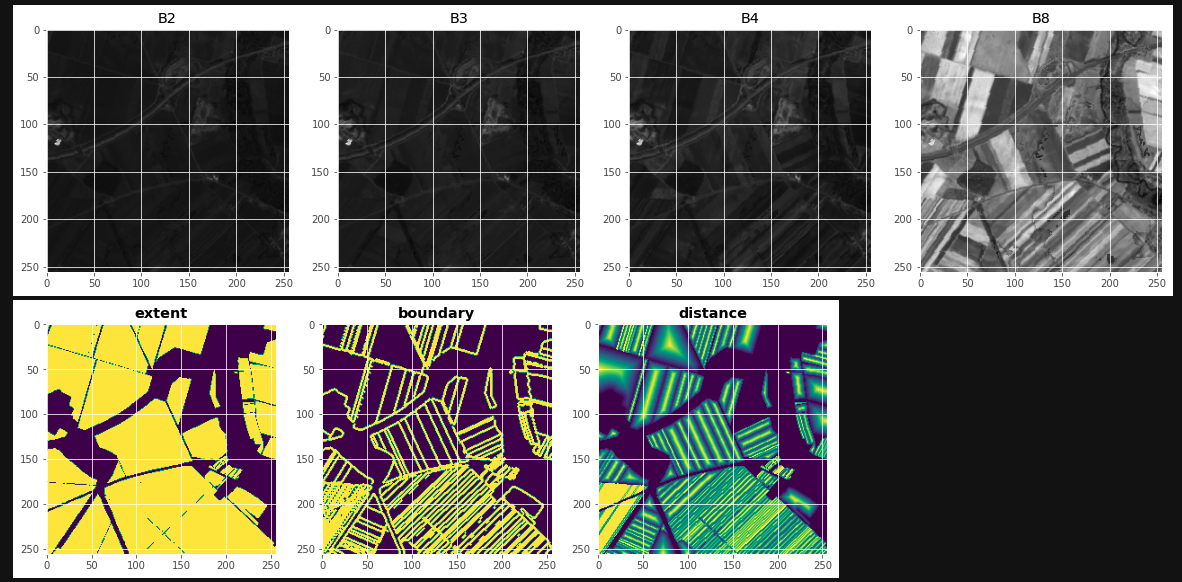
画像の読み込み
from osgeo import gdal
import numpy as np
from netCDF4 import Dataset
import matplotlib.pyplot as plt
import rasterio
from rasterio.plot import show

# base_file = 'AT_900_S2_10m_256';
# base_file = 'AT_316_S2_10m_256';
# base_file = 'AT_539_S2_10m_256';
base_file = 'AT_10260_S2_10m_256';

data = Dataset('test/'+base_file+'.nc')
fp = 'masks/test/'+base_file+'.tif'
img = rasterio.open(fp)
time_slice = 0 # 0 to 5
B2 = np.array(data['B2'][time_slice,:,:])
B3 = np.array(data['B3'][time_slice,:,:])
B4 = np.array(data['B4'][time_slice,:,:])
B8 = np.array(data['B8'][time_slice,:,:])

fig, (b2, b3, b4, b8) = plt.subplots(1,4,figsize=(20,10))
b2.imshow(B2,cmap='gray'); b2.set_title('B2')
b3.imshow(B3,cmap='gray'); b3.set_title('B3')
b4.imshow(B4,cmap='gray'); b4.set_title('B4')
b8.imshow(B8,cmap='gray'); b8.set_title('B8')

fig, (extent, boundary, distance) = plt.subplots(1,3,figsize=(14,10))
extent_img = img.read(1)
boundary_img = img.read(2)
distance_img = img.read(3)
show(extent_img, ax=extent, title='extent')
show(boundary_img, ax=boundary, title='boundary')
show(distance_img, ax=distance, title='distance')
マスク画像のextentとboundaryに対して面積を計算する
面積の計算にはscipy.ndimage.label, scipy.ndimage.sumを用いる(ChatGPTの情報)
from PIL import Image
import numpy as np
from scipy import ndimage

# ここでboundaryかextentかを切り替える
# array = np.where(boundary_img > 0, 1, 0)
array = np.where(extent_img > 0, 1, 0)

# 連結成分のラベリング
label_array, num_features = ndimage.label(array)

# 各ラベルの面積を計算
area_per_pixel = 100  # m2
areas = ndimage.sum(array, label_array, range(num_features + 1)) * area_per_pixel

# 結果を出力
s = 0
for i, area in enumerate(areas):
    print(f"Area of region {i}: {area} [m2] {area/4046} [acre] {area/10000} [ha]")
    s += area
ave = s/(len(areas)-1)
print(f"Mean area of region: {ave} [m2] {ave/4046} [acre] {ave/10000} [ha]")
ダミーデータでテスト
boundary_dummy = np.zeros((256,256))
boundary_dummy[0:5,:105] = 1
boundary_dummy[100:105,:100] = 1
boundary_dummy[:105,0:5] = 1
boundary_dummy[:105,100:105] = 1

extent_dummy = np.zeros((256,256))
for i in range(100):
    for j in range(100):
        extent_dummy[i,j] = 1
fig, (a, b) = plt.subplots(1,2,figsize=(10,5))
a.imshow(boundary_dummy)
b.imshow(extent_dummy)

extent_img = extent_dummy
boundary_img = boundary_dummy

from PIL import Image
import numpy as np
from scipy import ndimage


def calculate_area(img):
    # array = np.where(boundary_img > 0, 1, 0)
    array = np.where(img > 0, 1, 0)

    # 連結成分のラベリング
    label_array, num_features = ndimage.label(array)

    # 各ラベルの面積を計算
    area_per_pixel = 100  # m2
    areas = ndimage.sum(array, label_array, range(num_features + 1)) * area_per_pixel

    # 結果を出力
    s = 0
    for i, area in enumerate(areas):
        print(f"Area of region {i}: {area} [m2] {area/4046} [acre] {area/10000} [ha]")
        s += area
    ave = s/(len(areas)-1)
    print(f"Mean area of region: {ave} [m2] {ave/4046} [acre] {ave/10000} [ha]")
    print()

calculate_area(extent_img)
calculate_area(boundary_img)
本来であれば両方とも100haにならないといけない.
extentは100haになっているが、boundaryは20haという誤った値が出力されている.
Area of region 0: 0.0 [m2] 0.0 [acre] 0.0 [ha]
Area of region 1: 1000000.0 [m2] 247.1576866040534 [acre] 100.0 [ha]
Mean area of region: 1000000.0 [m2] 247.1576866040534 [acre] 100.0 [ha]

Area of region 0: 0.0 [m2] 0.0 [acre] 0.0 [ha]
Area of region 1: 200000.0 [m2] 49.431537320810676 [acre] 20.0 [ha]
Mean area of region: 200000.0 [m2] 49.431537320810676 [acre] 20.0 [ha]