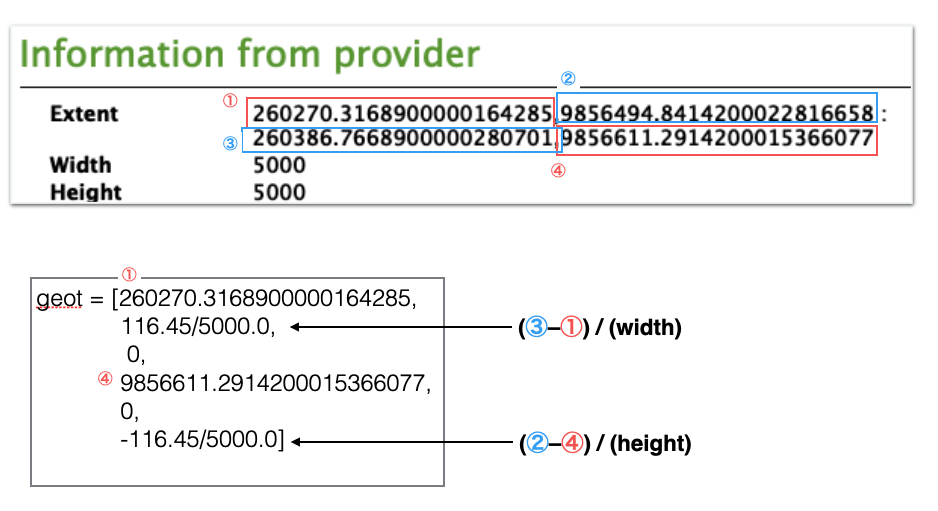
以下のgeotの計算方法
geot = [260270.3168900000164285,116.45/5000.0, 0, 9856611.2914200015366077, 0, -116.45/5000.0]
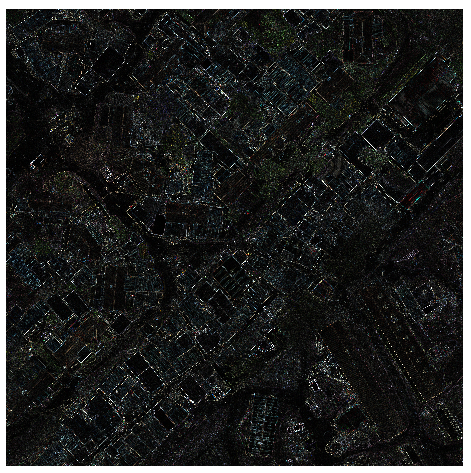
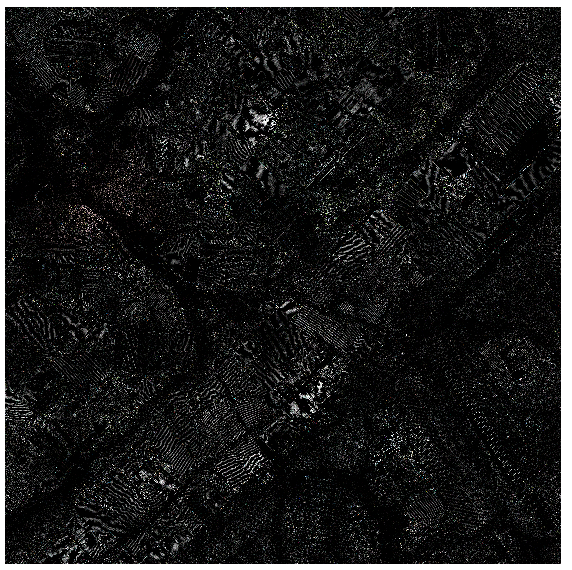
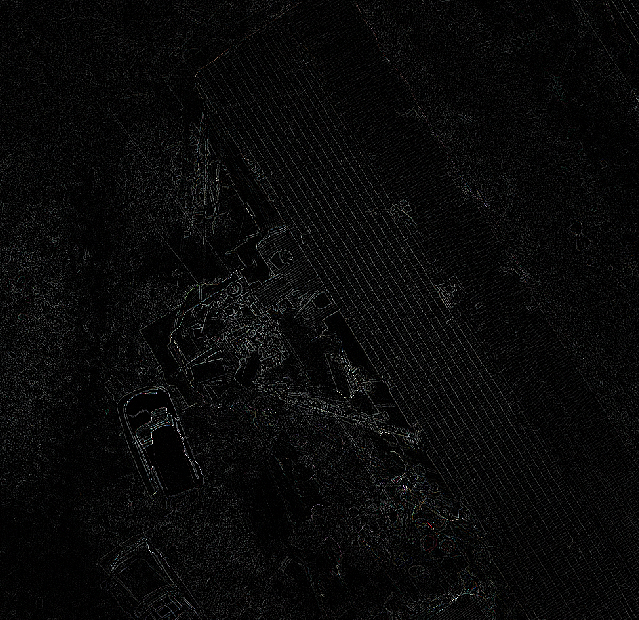
ラプラシアンフィルタの例
from osgeo import _gdal as gdal
from osgeo import osr
import numpy as np
import rasterio
import cv2
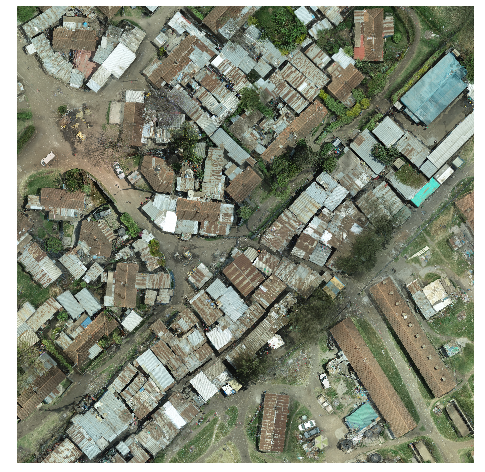
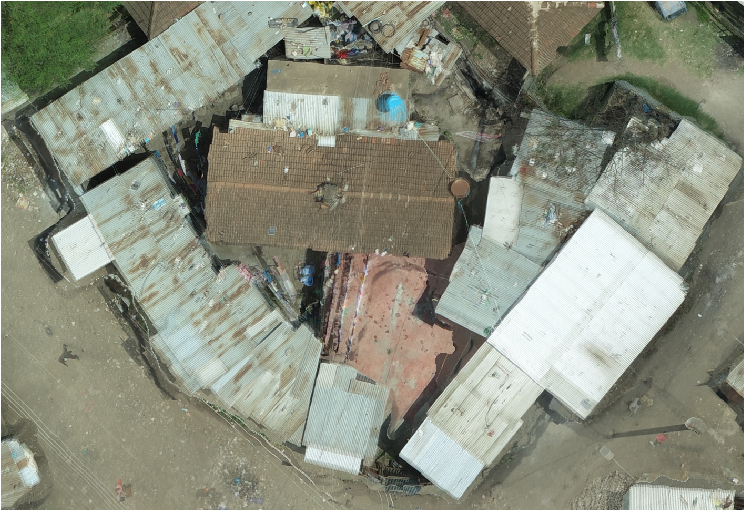
rasterPath = "/Users/shohei/Downloads/Eunice_transparent_mosaic_group1_3_5.tif"
layer = iface.addRasterLayer(rasterPath,"my raster")
ds_read = gdal.Open(rasterPath)
band1 = np.array(ds_read.GetRasterBand(1).ReadAsArray())
band2 = np.array(ds_read.GetRasterBand(2).ReadAsArray())
band3 = np.array(ds_read.GetRasterBand(3).ReadAsArray())
band1 = cv2.Laplacian(band1,cv2.CV_64F)
band2 = cv2.Laplacian(band2,cv2.CV_64F)
band3 = cv2.Laplacian(band3,cv2.CV_64F)
src = rasterio.open(rasterPath)
fn = '/Users/shohei/Downloads/laplacian.tif'
driver = gdal.GetDriverByName('GTiff')
ds_write = driver.Create(fn, xsize=src.width, ysize=src.height, bands=3)
ds_write.GetRasterBand(1).WriteArray(band1)
ds_write.GetRasterBand(2).WriteArray(band2)
ds_write.GetRasterBand(3).WriteArray(band3)
geot = [260270.3168900000164285,116.45/5000.0, 0, 9856611.2914200015366077, 0, -116.45/5000.0]
ds_write.SetGeoTransform(geot)
srs = osr.SpatialReference()
srs.SetFromUserInput("EPSG:32737")
ds_write.SetProjection(srs.ExportToWkt())
ds_write = None
rlayer = iface.addRasterLayer(fn, "laplacian")
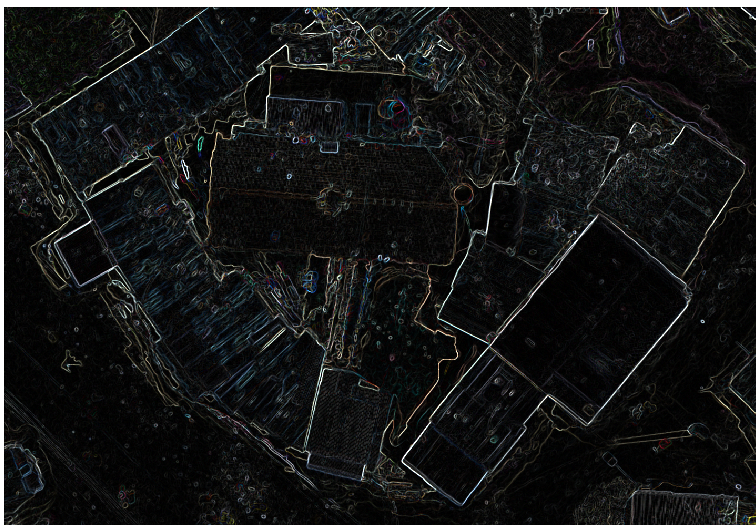
ソーベルフィルタの例
from osgeo import _gdal as gdal
from osgeo import osr
import numpy as np
import rasterio
import cv2
rasterPath = "/Users/shohei/Downloads/Eunice_transparent_mosaic_group1_3_5.tif"
layer = iface.addRasterLayer(rasterPath,"my raster")
ds_read = gdal.Open(rasterPath)
band1 = np.array(ds_read.GetRasterBand(1).ReadAsArray())
band2 = np.array(ds_read.GetRasterBand(2).ReadAsArray())
band3 = np.array(ds_read.GetRasterBand(3).ReadAsArray())
src_median = cv2.medianBlur(band1, 5)
sobel_x = cv2.Sobel(src_median, cv2.CV_32F, 1, 0)
sobel_y = cv2.Sobel(src_median, cv2.CV_32F, 0, 1)
sobel_x = cv2.convertScaleAbs(sobel_x, alpha = 0.5)
sobel_y = cv2.convertScaleAbs(sobel_y, alpha = 0.5)
band1 = cv2.add(sobel_x, sobel_y)
src_median = cv2.medianBlur(band2, 5)
sobel_x = cv2.Sobel(src_median, cv2.CV_32F, 1, 0)
sobel_y = cv2.Sobel(src_median, cv2.CV_32F, 0, 1)
sobel_x = cv2.convertScaleAbs(sobel_x, alpha = 0.5)
sobel_y = cv2.convertScaleAbs(sobel_y, alpha = 0.5)
band2 = cv2.add(sobel_x, sobel_y)
src_median = cv2.medianBlur(band3, 5)
sobel_x = cv2.Sobel(src_median, cv2.CV_32F, 1, 0)
sobel_y = cv2.Sobel(src_median, cv2.CV_32F, 0, 1)
sobel_x = cv2.convertScaleAbs(sobel_x, alpha = 0.5)
sobel_y = cv2.convertScaleAbs(sobel_y, alpha = 0.5)
band3 = cv2.add(sobel_x, sobel_y)
src = rasterio.open(rasterPath)
fn = '/Users/shohei/Downloads/sobel.tif'
driver = gdal.GetDriverByName('GTiff')
ds_write = driver.Create(fn, xsize=src.width, ysize=src.height, bands=3)
ds_write.GetRasterBand(1).WriteArray(band1)
ds_write.GetRasterBand(2).WriteArray(band2)
ds_write.GetRasterBand(3).WriteArray(band3)
geot = [260270.3168900000164285,116.45/5000.0, 0, 9856611.2914200015366077, 0, -116.45/5000.0]
ds_write.SetGeoTransform(geot)
srs = osr.SpatialReference()
srs.SetFromUserInput("EPSG:32737")
ds_write.SetProjection(srs.ExportToWkt())
ds_write = None
rlayer = iface.addRasterLayer(fn, "sobel")